
Python - Data Cleansing
I am not an expert data scientist or data engineer, but I have always been interested in coding ever since my first proper experience performing data analysis. It all started with my final year undergraduate project, where I somehow convinced both myself and my professors that I knew what I was doing with R. Spoiler: I figured it out. Statistical analysis, completed. Degree, survived.
The lesson I took away? The best way to learn is by doing — or in coding terms, by breaking things repeatedly until they work.
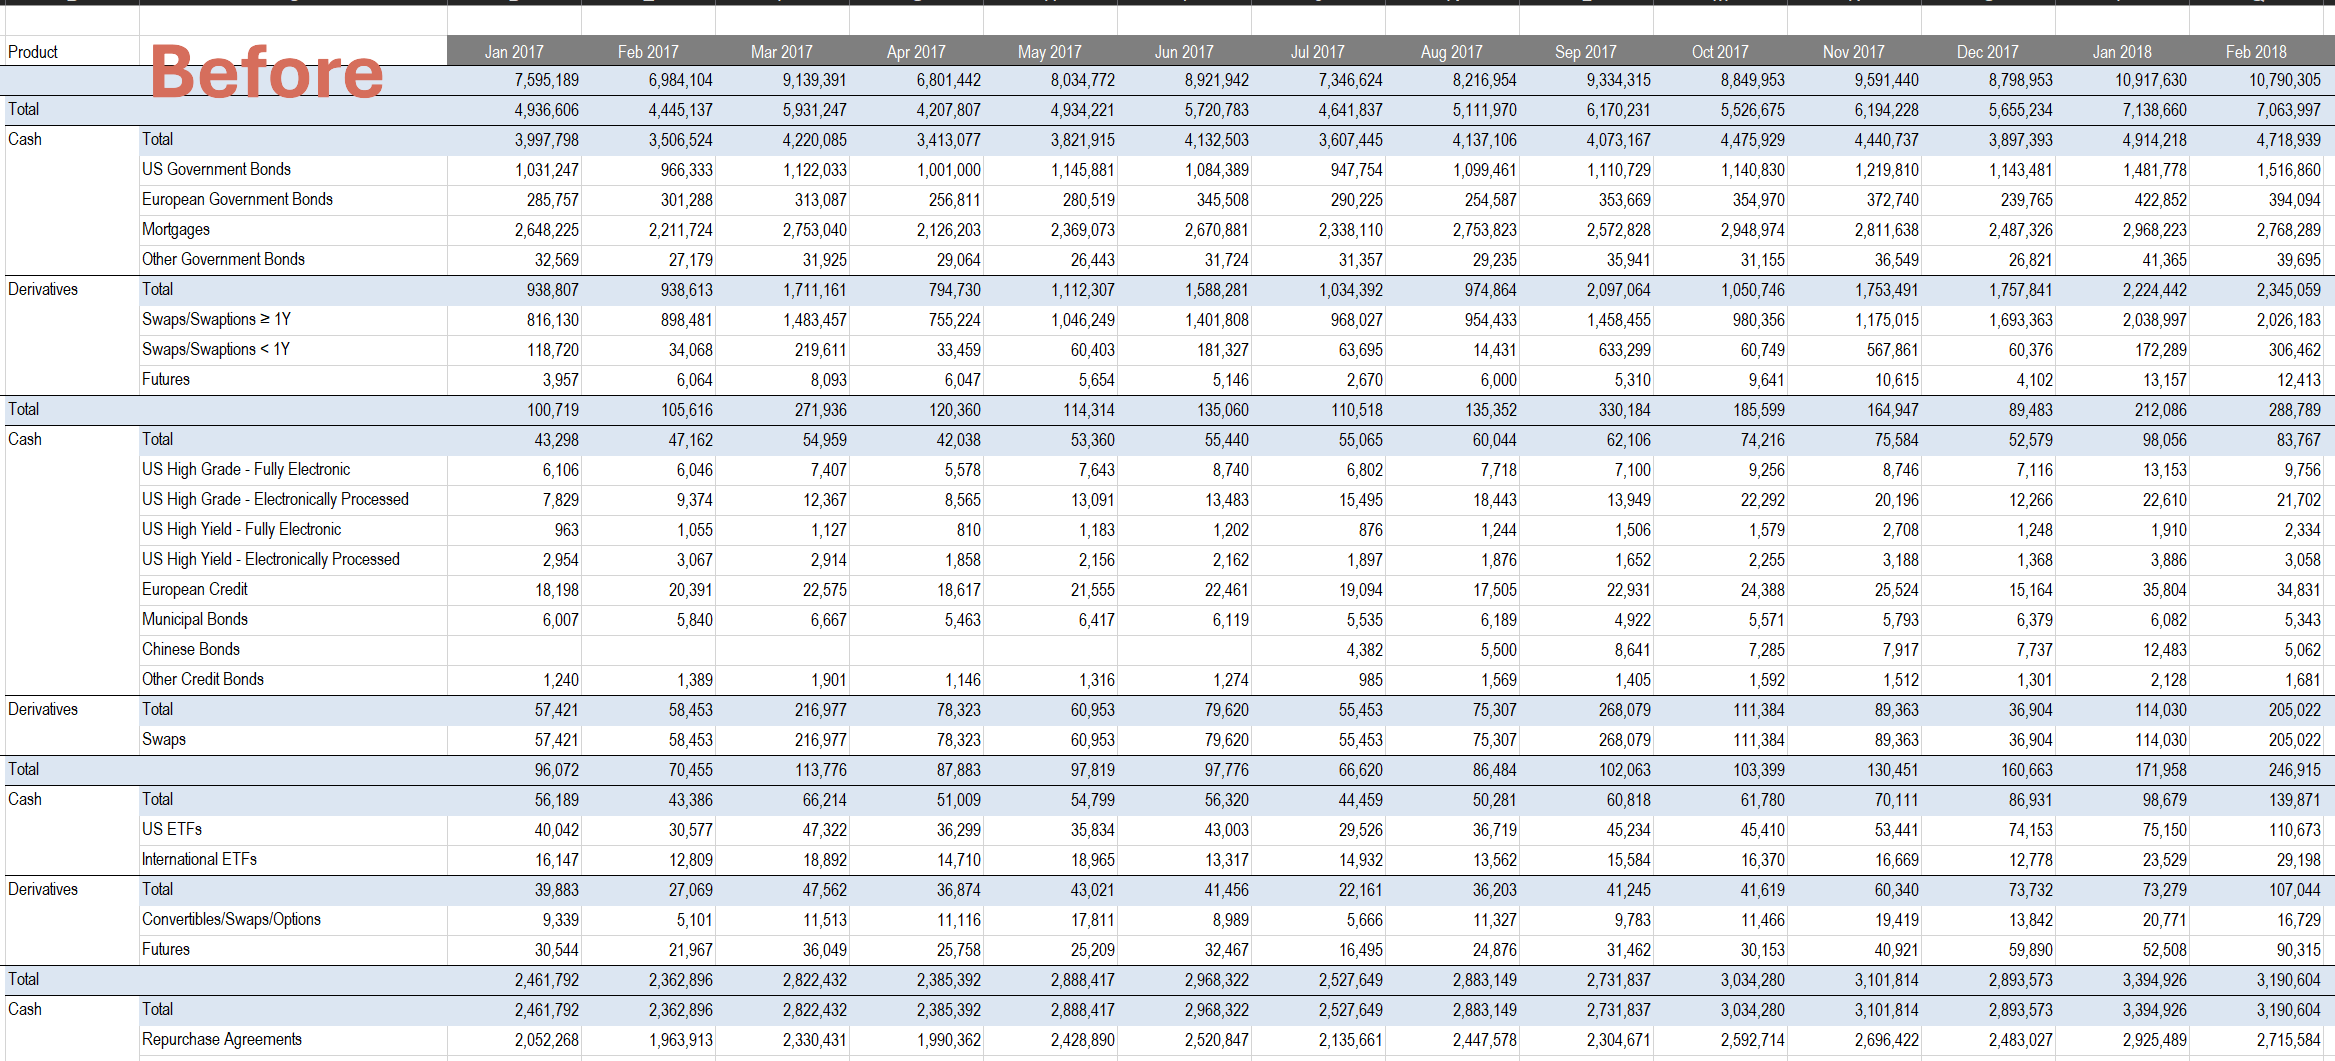
Here I am showing a quick example of how to clean using Python.
Key elements used:
-Uploading Excel files to Python
-Filtering
-Checking the nature of the data
-Renaming columns
-Aggregating data
-Transform data
-Removing #NAs
-Exporting data
Above I feel are key basics when cleansing data."
print ("Hello_World")
##Need to install openpyxl and Panda packages
import yfinance as yf
import pandas as pd
from pathlib import Path
import os
##Check where our current working directory is located. This is also where we will export our file
cwd = os.getcwd()
print("Current working directory:", cwd)
file_path = "/home/shoups/PycharmProjects/PythonProject/Test_Data_Files/Feb_ETF_Volume.xlsx"
##Here we skip the first row, header starts from second role. We came to this conclusion post inspecting
## the data.
df_etf = pd.read_excel(file_path,skiprows = 1)
print(df_etf.head())
print(df_etf.columns.tolist())
##Here we fill NAs with whatever is in the row above
df_etf["Asset Class"] = df_etf["Asset Class"].ffill()
df_etf["Product"] = df_etf["Asset Class"].ffill()
df_etf[df_etf.columns[2]] = df_etf[df_etf.columns[2]].ffill()
##Rename column 2, in Python we start counting column from 0
df_etf = df_etf.rename(columns={df_etf.columns[2]: 'Type'})
print(df_etf.tail())
##Checking all the unique variables within a column
print(df_etf["Asset Class"].unique())
print(df_etf["Product"].unique())
print(df_etf["Type"].unique())
print(df_etf.columns.tolist())
##Remove entire row when we see "Grand Total" in the column Asset Class
df_etf = df_etf[df_etf["Asset Class"] != "Grand Total"]
df_etf = df_etf[df_etf["Product"] != "Grand Total"]
df_etf = df_etf[df_etf["Type"] != "Total"]
df_etf.dropna(inplace=True, how="any")
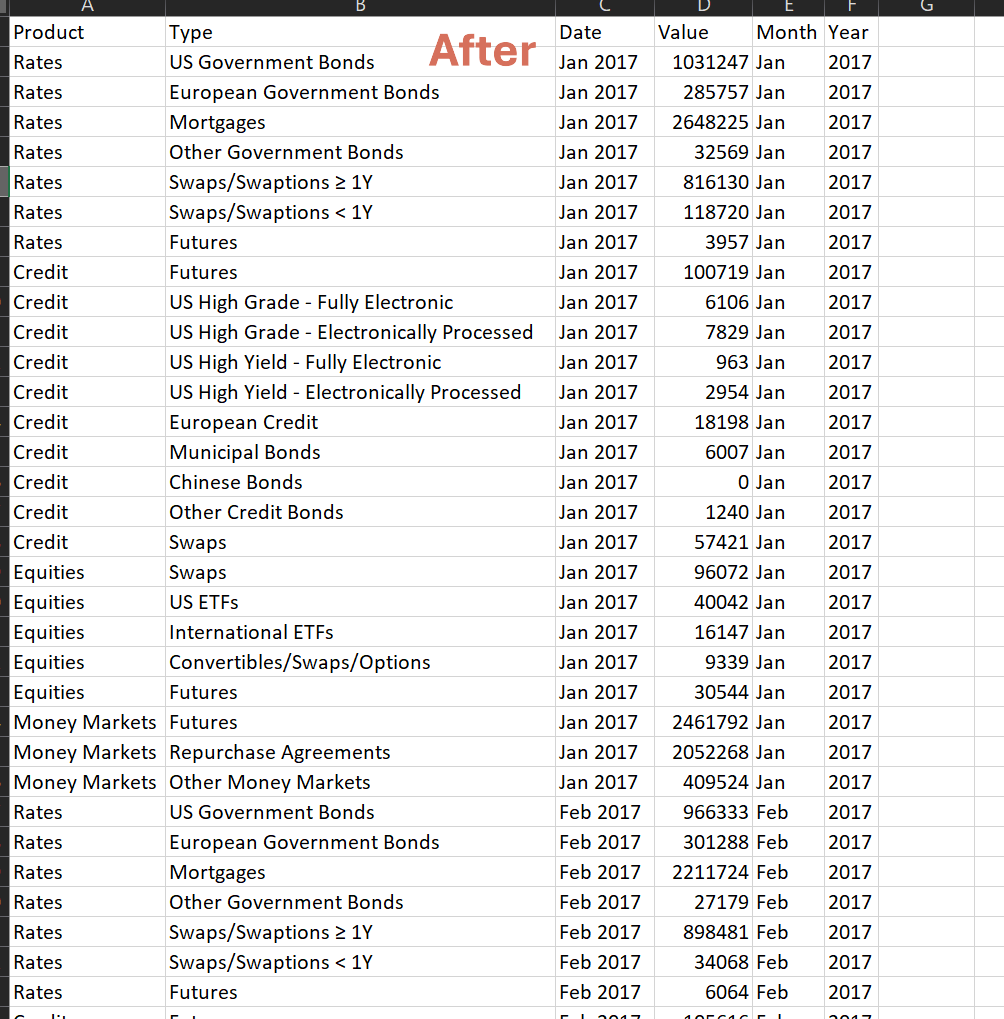
##Transform to tabular data format using melt from the Pandas library
df_etf_transform = df_etf.melt(
id_vars =["Asset Class", "Product","Type"],
var_name ="Date",
value_name ="Value"
)
df_etf_transform["Date"].info()
##Equivalent of using Excel Left and Right formulas
df_etf_transform["Date"] = df_etf_transform["Date"].astype(str)
df_etf_transform['Month'] = df_etf_transform['Date'].str[:3]
df_etf_transform['Year'] = df_etf_transform['Date'].str[-4:]
print(df_etf_transform.columns.tolist())
df_etf_transform = df_etf_transform.drop(df_etf_transform.columns[0],axis=1)
print(df_etf_transform.head(20))
print(df_etf_transform.tail(15))
##Export file to directory
df_etf_transform.to_excel("output_trade_volume.xlsx", index = False)