Tableau and R work great together.
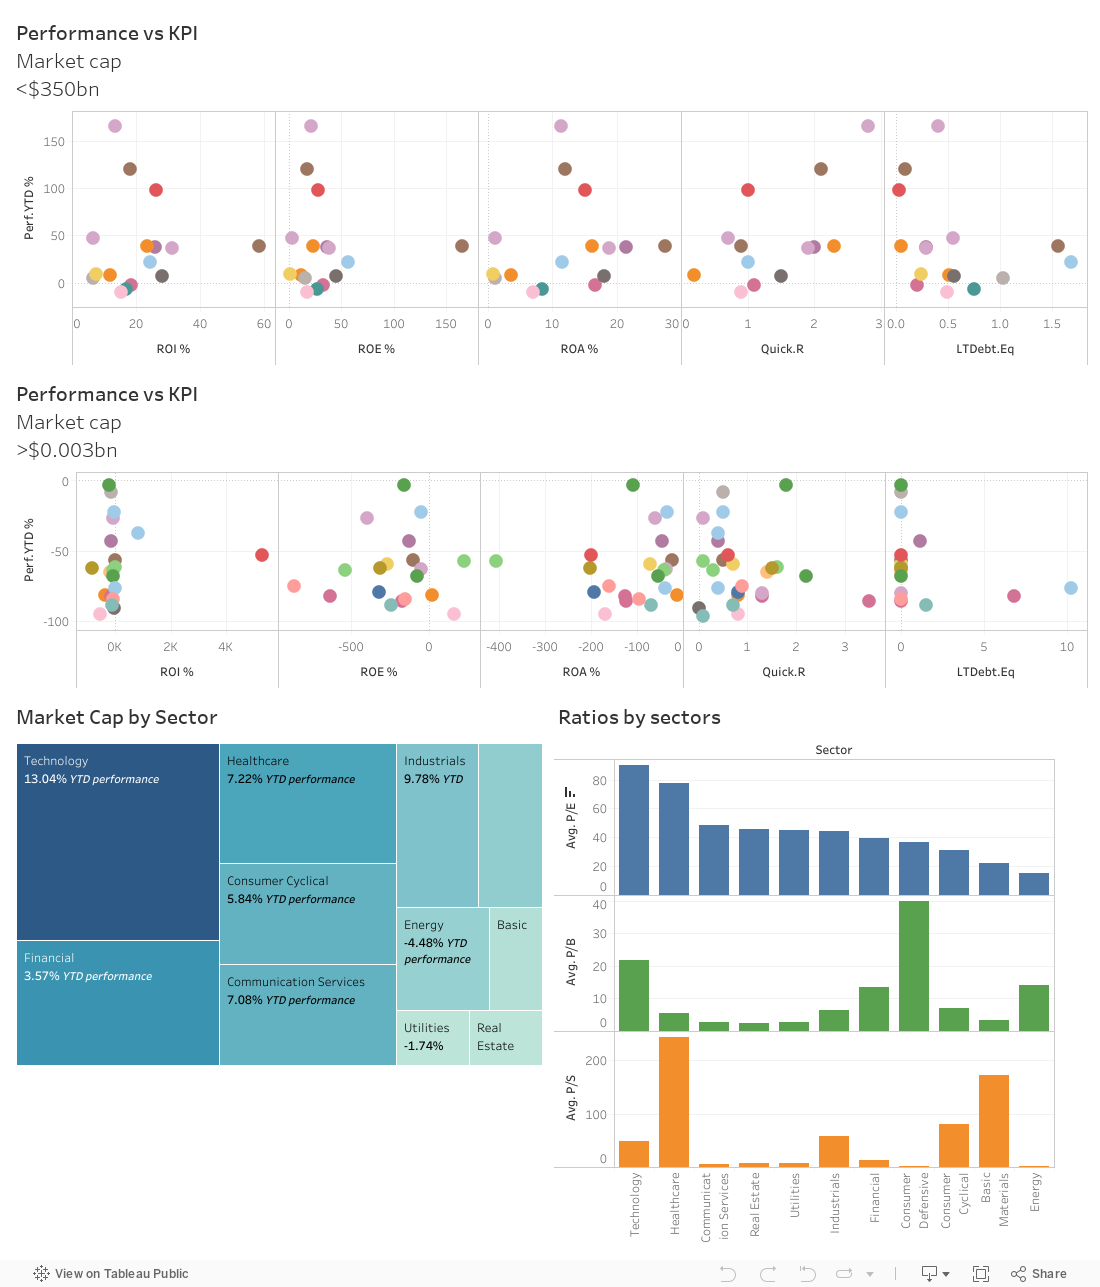
Here I used R to scrape data from Finviz and used Tableau for some simple data visualisation. The visualisation is good for quick and efficient stock screening on key ratios.
Finviz is a financial data subscription site. In order to export the financial data from the website, the fee is around 25-30 USD per months. However here, using R studio we are able to scrape the financial data from Finviz free of charge.
How the code works:
The code essentially takes key elements of the Finvis website, and repeats the process in order to scrape all pages.
We are able to do this because there is a pattern in the URL for page increase. For every page increase. The last section of the URL increases by 20.,
“//finviz.com/screener.ashx?v=111&r=21”
“//finviz.com/screener.ashx?v=111&r=41” -> +20 for every page increase.
The code also combines all the data we take from each subsection of the webpage. For example, we would first scrape data from the “Overview “ tab, then combine with what we scrape from the “Valuation” tab. This enables us to pull all the key elements of the website.
The end result of the R code is exporting the scraped data into an easily manageable Excel file.

Link to the code below (3 GBP):
Please open the file using either Notepad or Notepad++ (Notepad ++ would be the preferred option)

Visualisation below created using Tableau Public (free to use).
***The data was scraped on the 10th June 2023